What Is Ad Density and Why It Is Killing Your RPM
The logic seems airtight. It isn't. Here's why high ad density quietly destroys the revenue you're trying to build.
The math feels bulletproof. One ad unit earns you $1. So ten ad units should earn you $10. Double the slots, double the revenue. It's the kind of logic that makes complete sense until you actually try it — and then watch your RPM drop.
This is the ad density trap. And it catches more publishers than almost any other monetisation mistake. Not because they're careless, but because the logic is genuinely convincing. The problem is that programmatic advertising doesn't work like a vending machine. Filling every white space with a banner doesn't multiply your earnings. It fragments your auction, punishes your page speed, trains your readers to ignore you, and flags your site to the premium advertisers you actually want.
Maximising RPM in 2026 is not about volume. It's about scarcity and viewability. Fewer, better-placed ads — seen by engaged readers — will always outperform a page that looks like a car boot sale of banners. To understand how AdSense actually calculates what it pays per 1,000 views, you first need to understand what's silently eroding that number.
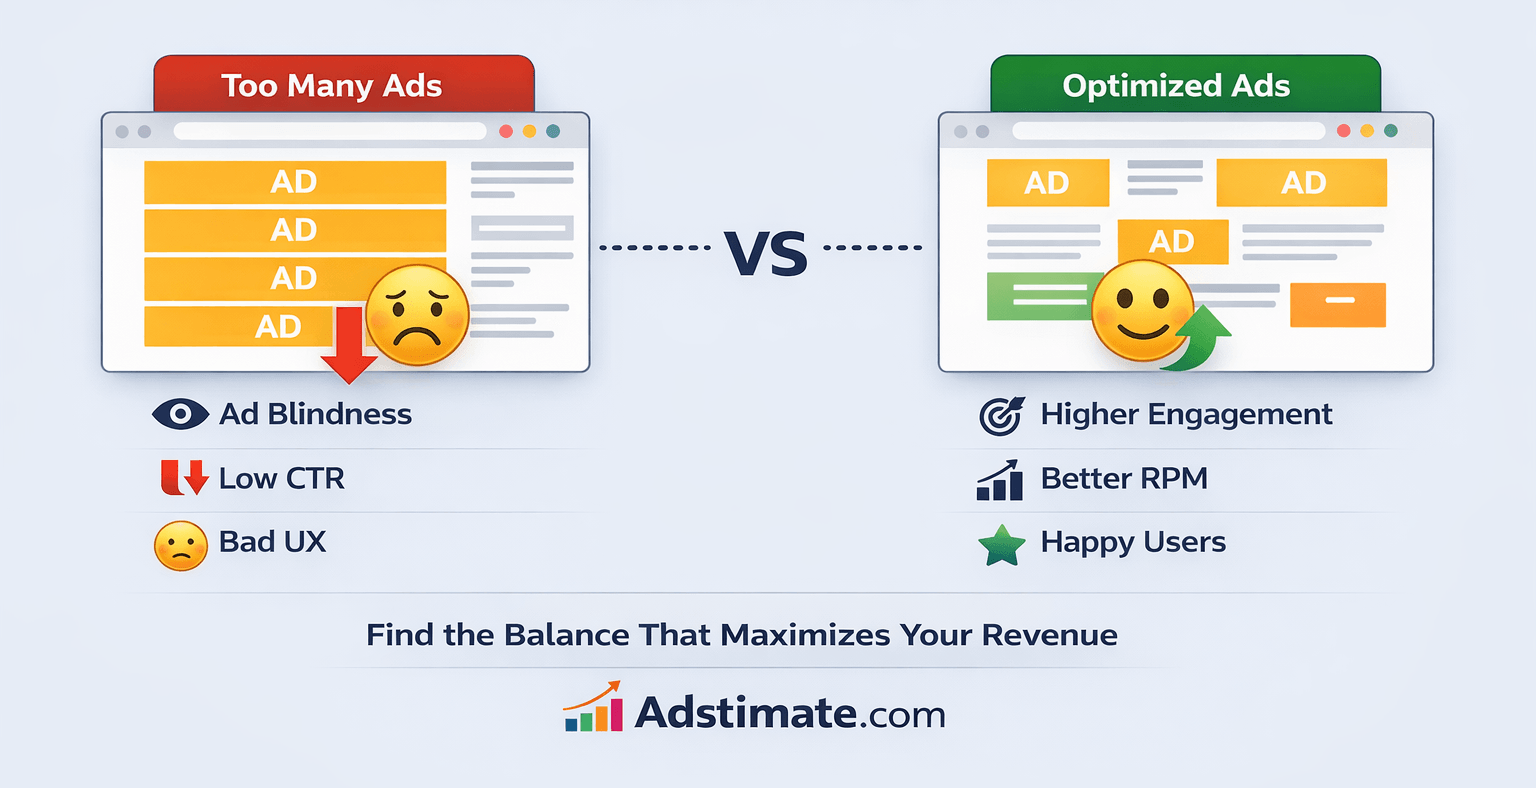
The Death Spiral: How Too Many Ads Destroy Your Auction
Here's what actually happens when you overload a page with ad slots.
Every ad auction runs on competition. The more advertisers competing for a single placement, the higher the winning bid. Your highest-earning impressions come from Tier 1 advertisers — premium brands, financial services, SaaS companies — who bid aggressively for viewable, high-quality placements. They have budget. They have standards. And they have limits on how many impressions they'll serve per page.
When you add too many slots, you exhaust those Tier 1 buyers after the first two or three placements. What fills the rest? Remnant inventory. Low-competition, low-bid ads from the bottom of the auction. You've just traded premium placements for pennies — and diluted your page RPM in the process. This is the core reason why high ad density lowers RPM even when impression count goes up. More slots, more remnant, lower average. The numbers move in the wrong direction simultaneously. If you've already noticed this pattern, the broader picture is covered in our breakdown of why high-traffic websites still make low ad revenue.
Use the Adstimate Calculator to find your RPM benchmark. If your current revenue is significantly lower, consider auditing your ad density.
Try the Adstimate AdSense CalculatorThen there's the speed problem. Ad density meaning — in technical terms — is the ratio of ad elements to content elements on a page. Push that ratio too high and every additional unit adds render-blocking scripts, third-party calls, and layout-shifting elements that directly damage your Core Web Vitals. A poor LCP (Largest Contentful Paint) score tells Google your page is slow to deliver its main content. A poor CLS (Cumulative Layout Shift) score means your layout jumps around as ads load. Both tank your search rankings. Less organic traffic means fewer impressions total — which compounds the revenue drop you were already experiencing from the auction side.
The comparison that makes this concrete: three high-paying ads on a page a reader stays on for five minutes will always earn more than ten ads on a page they abandon in thirty seconds. Session duration is not a vanity metric. It's the variable that determines how many of your ad slots actually get seen.
Why 2026 Advertisers Are Scoring Your Layout
This is the part most publishers haven't caught up with yet.
Premium Demand Side Platforms (DSPs) — the systems through which high-paying brands buy ad inventory — now use AI to evaluate page layouts before placing a bid. They're not just checking if your content is brand-safe. They're checking your ad-to-content ratio. If your page is classified as having too many ad units relative to readable content, it gets flagged as Made for Ads (MFA) — a classification that causes premium buyers to exclude your inventory entirely.
One news publisher got flagged as MFA by three premium DSPs in the same month. He didn't know until he cross-referenced his programmatic revenue drop with his layout audit. His ad-to-content ratio had crept to 1:1.8 after six months of gradual additions. The premium buyers had already left quietly.
You don't get a warning. Your RPM just quietly drops as the high-paying brands stop bidding. What's left is the remnant pool. And you're back in the death spiral. If your ad serving has already been affected by quality signals, understanding how ad serving limits work is the right place to start your diagnosis.
Viewability makes this worse. An ad unit sitting at the bottom of a 2,000-word article has zero viewability if your average reader leaves at the 800-word mark. The impression is counted. The ad loaded. But nobody saw it. Premium DSPs track viewability rates per publisher — and a consistently low viewability score reduces the bids you receive across your entire site, not just on the underperforming placements.
The ad fatigue impact on revenue is the final layer. Human brains are remarkably good at filtering repetitive visual patterns. When readers see the same banner format in the same positions on every visit, they stop processing those positions consciously. CTR drops. Engagement drops. The algorithm notices. Your quality score drops with it.
Finding the Sweet Spot: Optimal Ad Density for Publishers
So what does the right setup actually look like?
The benchmark that holds up consistently in 2026: ads should never occupy more than 30% of the vertical screen real estate at any given scroll position. At any point as the reader moves down your page, the content should dominate. The ads should be present — not competing with the reading experience for dominance.
In practice, optimal ad density for publishers follows a simple spatial logic:
- Above the fold: One high-impact unit. Not two. The first impression should be clean — content visible, one ad present, no clutter.
- In-content placements: Space them every 500–700 words. This gives the reader enough content between each unit that the ads feel contextual rather than intrusive.
- Sticky sidebar or sticky footer: Use one. Never both simultaneously. Two persistent elements competing for attention cancel each other out and damage the reading experience on mobile.
Then there's the element most publishers actively resist: white space. Empty space on a page is not wasted space. It's the contrast that makes your remaining ad units visible. A banner surrounded by breathing room draws the eye. A banner sandwiched between two other banners gets processed as background noise. User experience vs ad revenue is not the zero-sum trade-off it's often framed as — a better reading experience directly produces higher CTR on the placements that remain. For a data-backed approach to which specific positions actually perform, use heatmap data to identify your genuine high-CTR zones rather than guessing.
If you're currently running Auto Ads with no manual constraints, that's likely the root of the problem. Auto Ads optimise for impression volume, not auction quality. The fix is a hybrid approach — let Auto Ads handle sticky formats like anchors and vignettes, and take manual control of your in-content placements. The full breakdown of that setup is in our guide on Auto Ads vs. Manual Units in 2026.
The Remove and Measure Experiment
You don't have to take any of this on faith. Run the test.
A tech publisher ran the Remove and Measure experiment reluctantly. Week one: revenue dropped 12%. Week two: session duration up 34%, RPM up 28%. By day 21, total monthly revenue was tracking 18% above the previous month. He left the units off permanently.
Identify your lowest-performing 20% of ad units — the ones with the worst viewability, lowest CTR, or positions that fall below your average scroll depth. Turn them off. Not forever. For 14 days.
Then watch the right metrics. Not just CPM. CPM will likely rise as remnant slots disappear and your remaining placements attract stronger bids. But also watch session duration and pages per session. These tell you whether the reading experience has improved. In most cases, removing low-performing units increases both — which sends stronger engagement signals to Google, which supports better rankings over time, which brings higher-quality traffic to your remaining placements.
The result most publishers see: revenue stays flat or dips slightly in week one, then recovers and often exceeds the previous baseline by week two as bid quality improves and session metrics strengthen. Treating your layout as a ratio to actively manage — rather than a container to fill — is what makes this sustainable. That's the real meaning of an ad density calculator mindset: not a tool you run once, but a discipline you apply continuously.
The Long Game
A website is an asset. Not a billboard.
Billboards maximise surface area. Assets maximise value per unit. The publishers consistently earning the highest RPMs in 2026 are not the ones with the most ad slots. They're the ones whose readers stay longest, return most often, and whose pages premium DSPs actively seek out because the inventory is clean, viewable, and brand-safe.
Respecting your audience's attention is not a UX philosophy. It's a revenue strategy. Give your readers less to ignore and they'll engage with more of what remains. That engagement is what the auction rewards — with better bids, higher CPMs, and an RPM that actually reflects the quality of what you've built.
Fewer ads. Better placement. More money. The math works — just not the way most publishers expect it to.